What is Forex Footprint? Footprint chart
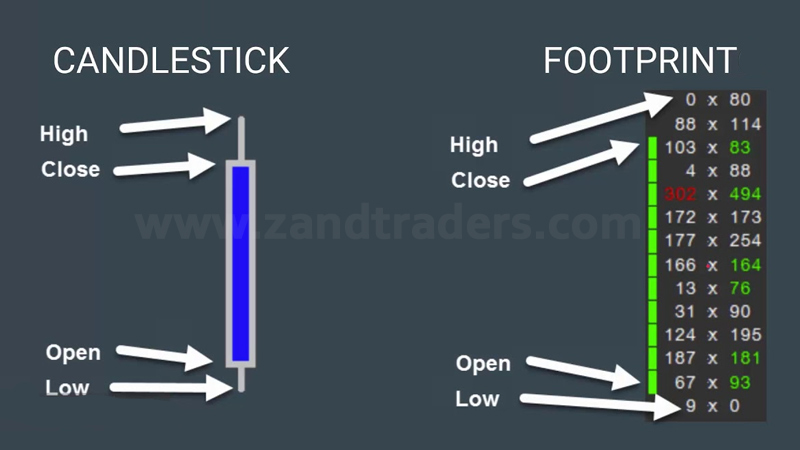
Footprint charts, also known as Forex footprints, are candlestick charts that show traders other information in addition to price, such as trading volume and order flow. The nature of footprint charts is multidimensional and provides the investor with information beyond the price of securities for market analysis, and is a unique tool that is particularly popular among traders.
In this article, Zand Traders will introduce you interesting and useful information about what is Footprint in Forex, what does Footprint Chart include and what Foot Print Trading is. Please stay with us.
Introducing Forex Footprint for a better understanding
As mentioned, footprint charts are multidimensional charts that allow traders to view additional market variables overlaid on the candlestick chart, including volume information, bid price spreads, and Liquidity levels. Footprint chart actually shows the volume of sales orders inside a candlestick.
In this way, traders have the ability to customize Forex footprint charts for themselves to include the variables of traders who are most interested in tracking them. Like standard candlestick charts. Traders can also customize the time frame of charts to analyze the movement of securities in the short, medium or long term.
In general, Forex footprint charts allow you to analyze multiple variables in a centralized chart, and this is one of its biggest advantages. These charts may also be grouped with other multivariate charts used by advanced traders, such as Level 2 Price Charts or Market Depth Charts (DOMs).
Briefly about Market Delta
Market Delta is one of the most popular Forex Footprint chart software providers available through monthly subscriptions. The Market Delta platform connects with many of the top brokerage firms to enable business automation. Market Delta also offers many different customizable data feeds at an additional cost.
Familiarity with different types of foot print charts
Do you know the different types of footprint charts and do you know what are the types of Forex footprint? Some of the most common Forex footprint charts used by many traders include the following:
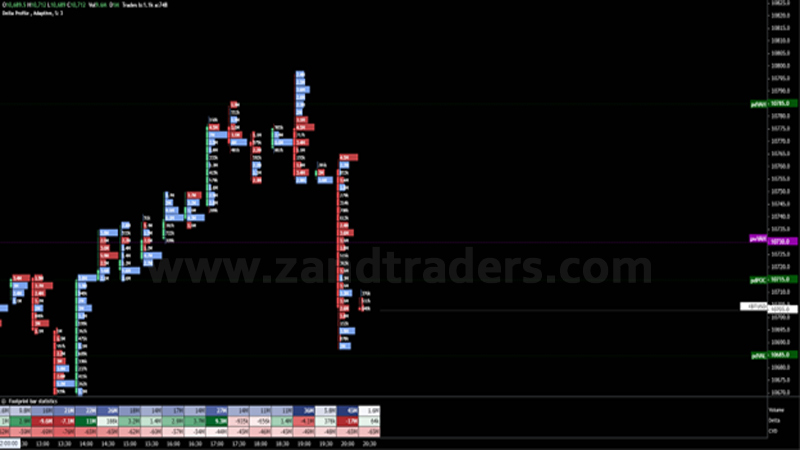
Footprint profile
This type of footprint chart shows traders the volume at any price, through a vertical histogram, in addition to the usual Forex footprint bars. Footprint Profile Chart allows traders to see the intersection of liquidity and price.
Bid/ask footprint
In this type of footprint chart, the color is added to the real-time volume for easier visualization of the buyers and sellers who are considering the offer or request. Through this Forex footprint, traders can see if buyers or sellers are responsible for influencing price movements.
Delta footprint
In this type of Forex footprint, the net difference in each price is displayed between the volume started by buyers and the volume started by sellers. The Delta Footprint chart helps traders verify where the price trend started and will continue.
Volume footprint: Unlike the volume histogram in traditional charts, the volume footprint shows the volume not only by time but also by price. The purpose of this Forex Footprint chart is to help traders determine the points of capitulation or surrender.
The Importance of Footprint Charts
Footprint charts have more advantages than regular Candlestick charts; Because Forex Footprint shows you exactly the volume traded on the price and there is a limited graphical display of the order book where you only trade the volume; While with the normal Candlestick chart, you will not receive this information. Footprint charts are important because you can easily interpret the reason for the price movement.
What exactly you will see in a Forex Footprint chart is:
-Vpoc, most traded volume in the candle
-Trading volume in ASK
-Trading volume in BID
-Candle opening
-Close the candle
-High level and low level candle
-Buy or sell imbalance (if marked)
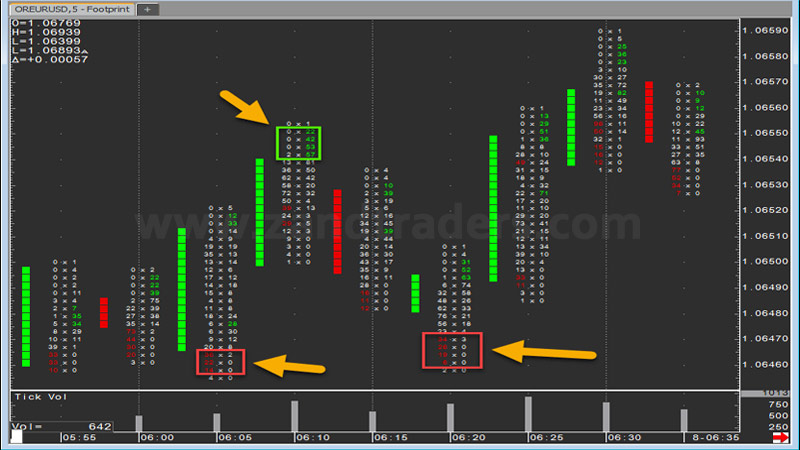
Through Forex Footprint Charts, traders can interpret trading volume and develop trading strategies. For example, it is easy to see through the footprint chart whether the market is stopping trading at the price level or trading high volume?! Also, you can find out if there is more pressure or demand pressure in a candle or not?!
How to read Foot Print Chart
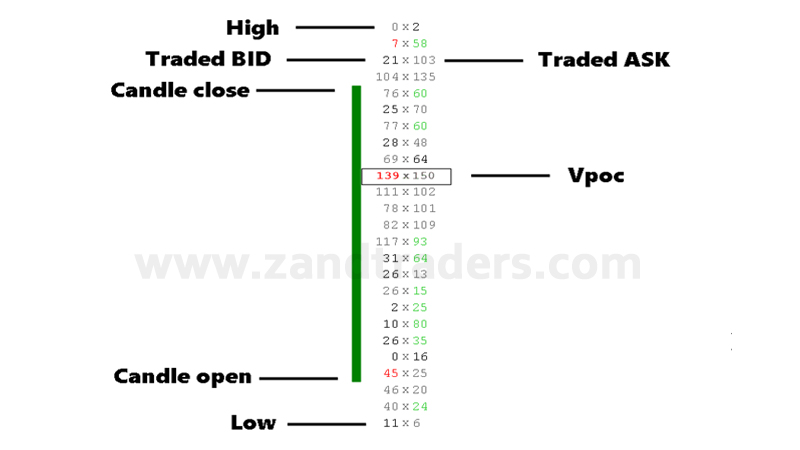
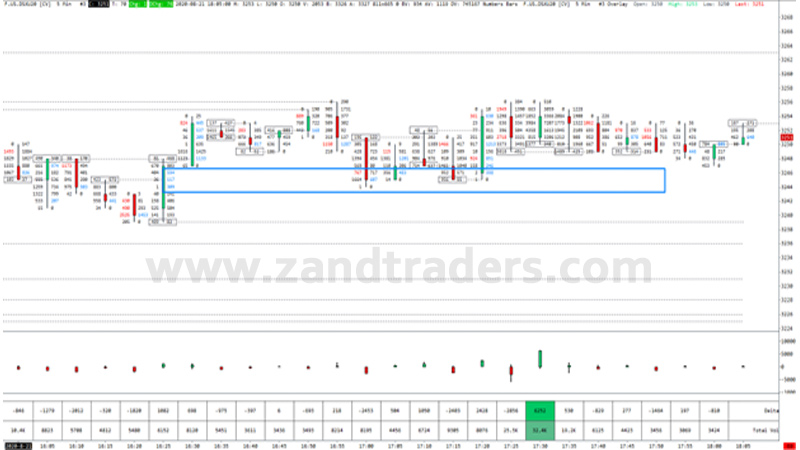
In the image below, you can see the details of the Footprint Chart. In the next section, you will learn how to read it. There are several parts of a candlestick in the Forex Footprint chart shown on the figure: Vpoc, candlestick up and down, candlestick opening and closing, BID and ASK traded, which we have briefly explained below.
Up and down
In a footprint chart, as shown in the image above, the highest and lowest levels of the candlestick are shown.
Candle opening and closing
In one Forex footprint you can see in what volume of trades the candlestick opens or closes.
Vpoc – Control point (volume)
Vpoc means “volume control point”. This number indicates the price at which the maximum volume of the transaction is done. For Vpoc there are several settings, but the most popular is displaying the largest transaction volume. In this way, you can analyze whether the volume is at the top, middle or bottom of the candlestick, which allows you to trade different strategies.
BID traded and ASK traded
BID stands for Limited Purchase Orders, which are generated by market sales orders. ASK means limited sales orders created by market buy orders.
The Forex market generally operates through a limited order book and is based on moving market orders or stopping orders. For example, if a trader has bought, you will see in the Forex Footprint chart that the trader is failed.
In addition, as market orders work towards high and low order limits, you can see on the footprint chart where the highest volume has been traded and where the lowest volume has been traded.
Red or green colored numbers
In the picture above, you can see the red and green colored numbers. These numbers with different colors are imbalances that automatically exist in the market; and it depends on your strategy which imbalance you want to see in the chart. In this chart, red and green numbers show you strong buying or selling pressure.
Familiarity with Footprint Trading Strategies
To get acquainted with Forex Footprint trading strategies, please read this part of the article. We are captivated by the Footprint Trading strategy.
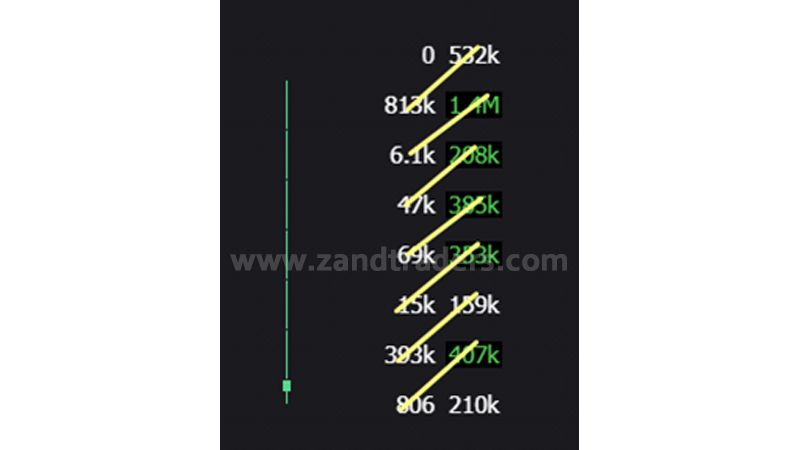
Buy / sell imbalance
Imbalance shows you where buyers are overcoming sellers and vice versa. The imbalance of sales or purchases in footprint charts is compared diagonally, not horizontally.
During the trading day, you will see many imbalances. That’s why you should only pay attention to the ones that are stacked together. Using at least three accumulated imbalances shows you the obvious power by buyers or sellers.
So, once you identify those levels, you can use them as futures support / resistance areas, because heavy buyers / sellers want to keep their prices.
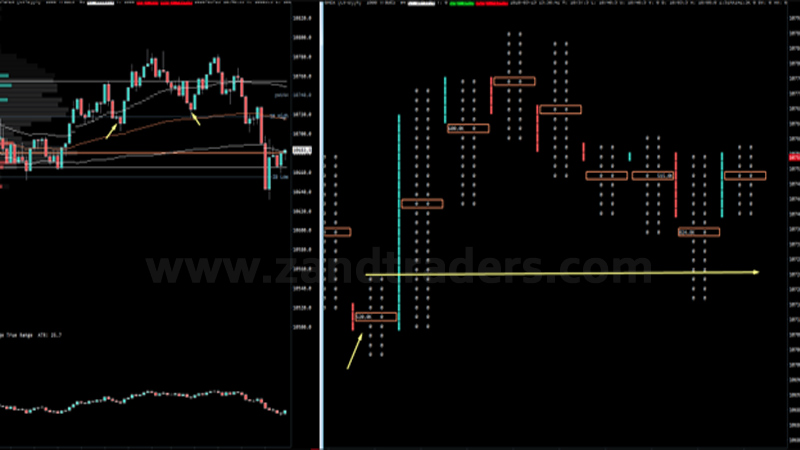
Finished / Unfinished Auctions
Usually in the market, prices go up or down until they reach a point where no one is interested in buying or selling anymore. If the markets go up, it will continue to do so until someone else is no longer interested in buying.
But if the market falls, it will continue to do so until someone else is no longer interested in selling.
The completed auction is held when there is zero bid at the peak, or zero bid at the lowest prices. Conversely, an auction is unfinished when there is no zero at the top or bottom of the bar; this shows that the auction is not over.
Volume imbalance
By looking at the footnote volume chart, you can get an idea of where the largest volume of trades is done. If the market is climbing, the maximum volume should be at the top of the bodies and vice versa.
Volume imbalances occur when their candle closes on the opposite side of a significant volume.
Large size tracking
What is rarely discussed in footprint trading is the use of filters that filter footprint by size. Seeing when big traders enter the market is one of the strongest approved trading ideas.
The items mentioned above are among the footprint trading strategies.
Concluding remarks on Forex Footprint
In the article before you, we introduced you another trading strategy, namely Footprint Chart or Footprint Forex. Footprint chart is the volume of sales orders within a candlestick; and now you know what Forex Footprint is and what trading strategies are exist for it.
We hope that the content mentioned has been useful for you dear ones.