Introducing the features of the Ninja Trader’s platform in the second part (Data series & Properties)
Introducing the features of the Ninja Trader’s platform in the second part (Data series & Properties)
In the first part, by opening the chart of a futures symbol, we learned about the various features of the Ninja Trader’s platform in the chart window. Now open the Data Series tab from the top tabs of the chart we opened. One of the most important options available in this window is the Tick Replay option.
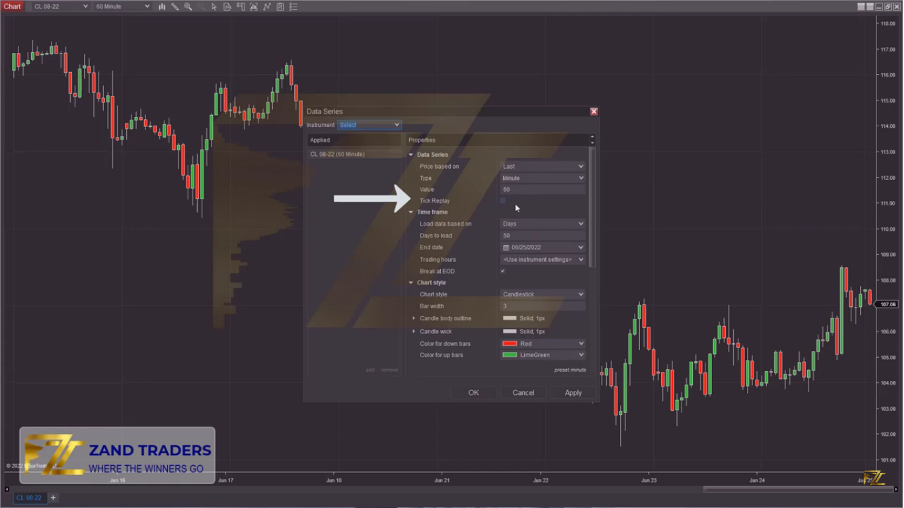
This option is for opening the chart with higher accuracy, you can compare the difference between the chart with active Tick Replay and the chart without Tick Replay in smaller time frames. In addition to the fact that this option increases the accuracy of the chart, some add-ons that are implemented on Ninja Trader need this option to be active in order to perform chart analysis with high accuracy.
If the Tick Replay option was not displayed in the Data Series window, you should activate the Tick Replay option as follows.
Go to the main window of Ninja Trader and select the path Tools/Option/Market Data, in this section you will activate the tick related to Tick Replay.
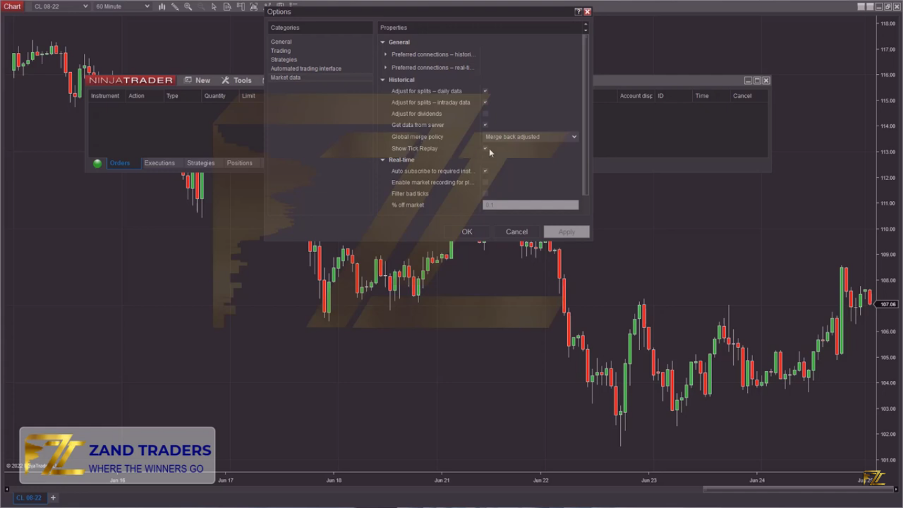
Now we return to the Data Series window and activate the Tick Replay option.
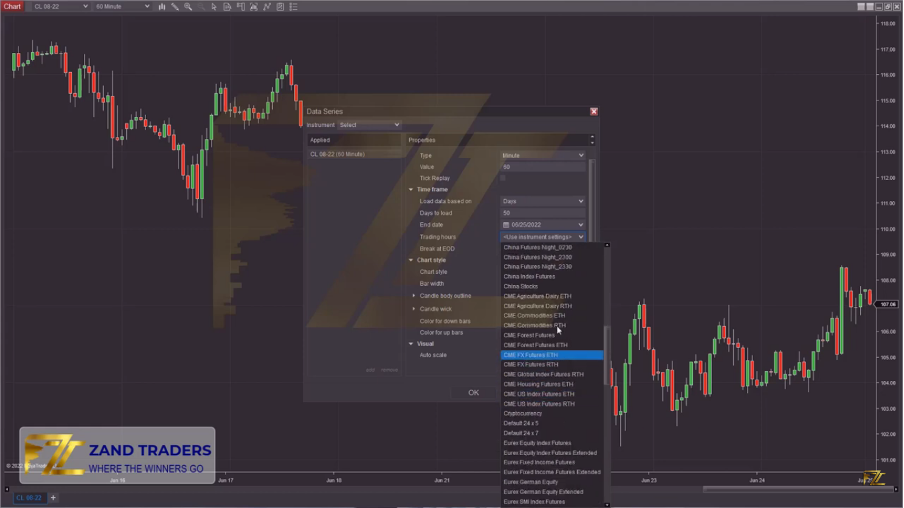
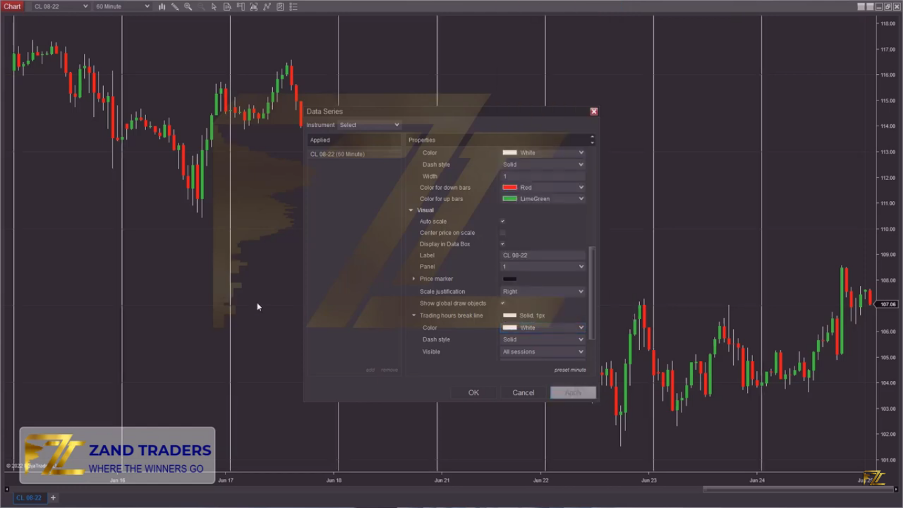
The next part is the Time Frame, the Days to load option is for choosing the number of days we want the chart to be displayed, the Trading Hours option is for choosing different sessions, which are selected according to your strategy, instrument and trading hours. For example, to view the chart in the European session, we should select the Eurex German Equity option, and to display the chart in the American session, we should select the CME US index futures RTH option.
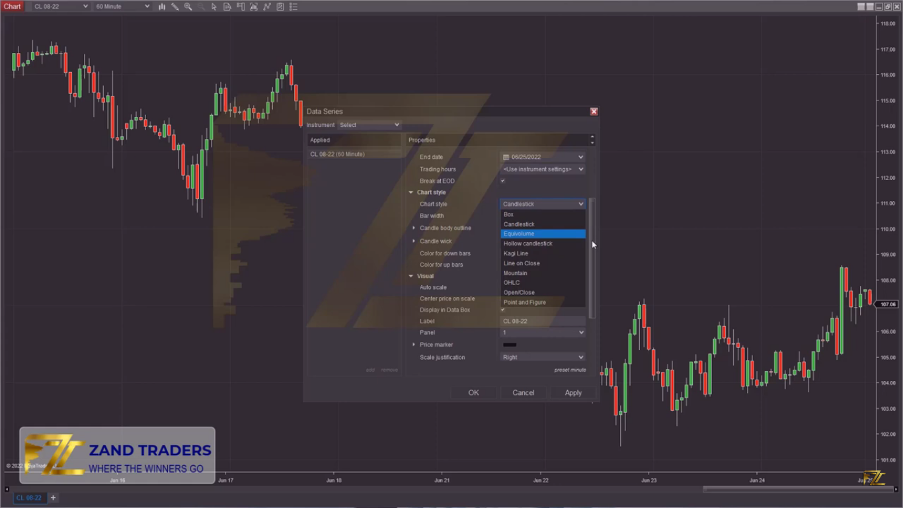
In the Chart Style section, you can view the chart in different ways, such as Candle or Hiken Ashi, etc. Bar width is also used to change the width of the candle. In the next section, you can change the color of the candle body and the color of the candle shadows. This part depends on your personal taste and can be easily customized.
In the Visual part, we have an important option called Trading Hours Break line, which are the vertical lines separating our selected session, which show us the beginning and end of the session.
In the Trades section, you can enable or disable the display of the trades you have made. If you select the Don’t Plot option, trading information will not be displayed on the chart.
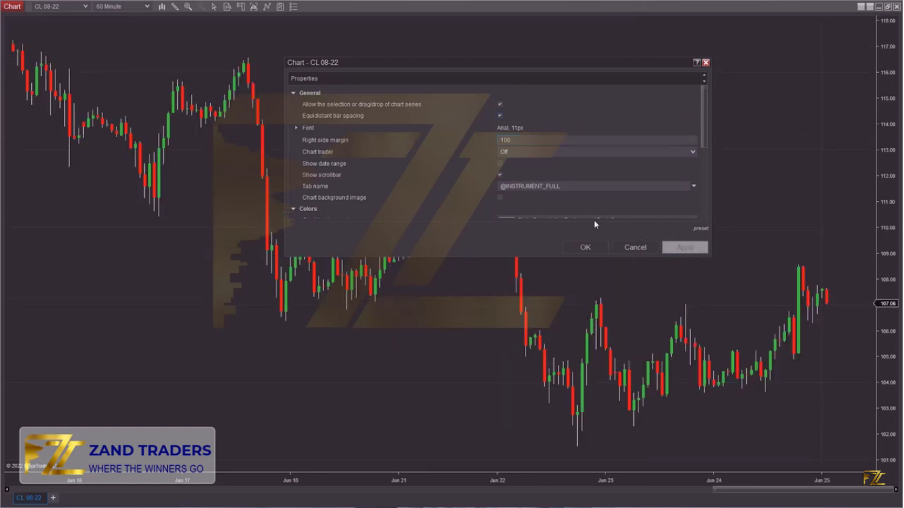
In the rest of this article, we will explain the properties tab:
In this window, the first important option is Right Side Margin, this option shows the distance of the last candle from the right edge of the monitor or chart, by increasing it, the distance of the candles from the right edge of the chart increases, and as a result, you get a better view.
By selecting Chart Background Image option, you can choose a desired background image for your chart.
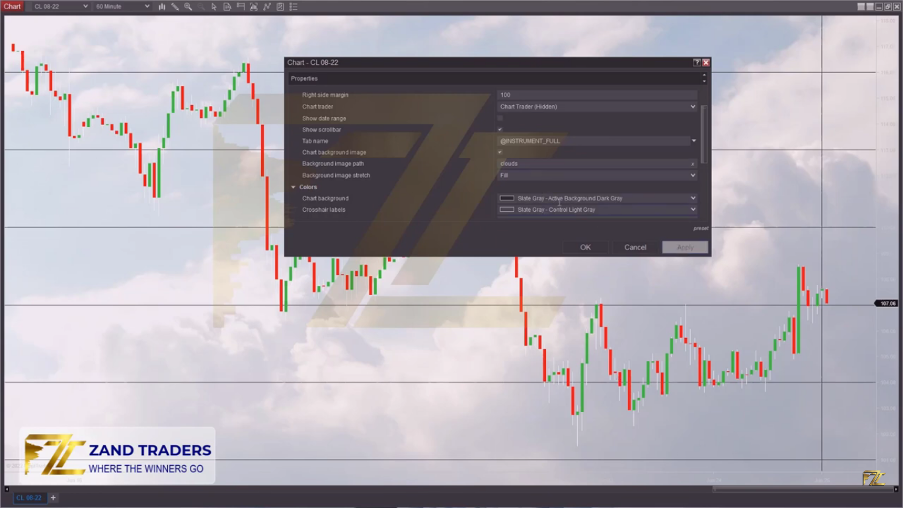
In the Colors section, you can change the color of each item in the chart. Axis color, text, numbers, mouse display and…
In the Grid line section, you can customize the color, size, and display or non-display of the chart surface lines, and by selecting the transparent option, they will no longer be displayed.
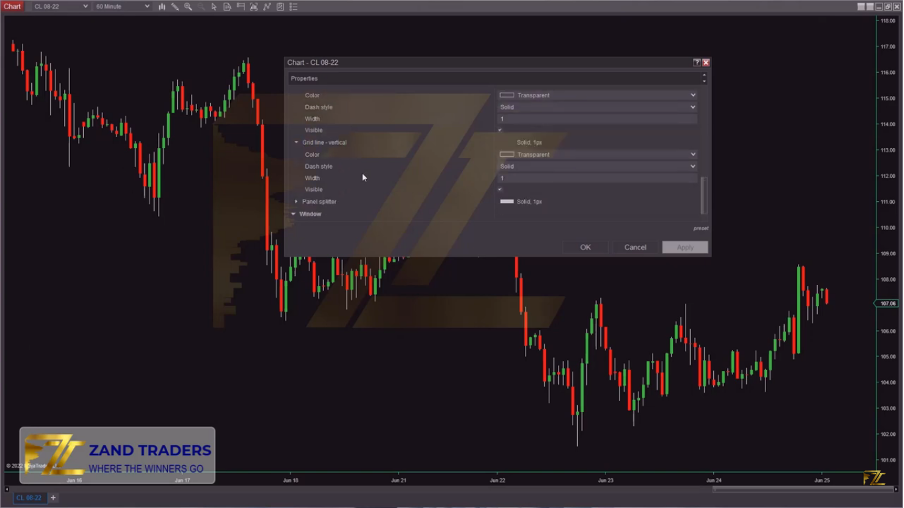
In volume trading, because we use important volume edges, we empty the chart as much as possible to load necessary software and indicators so that we can more easily identify important lines.