What is Ninza Renko?
What is Ninza Renko?
Renko Chart is a type of chart developed and presented by the Japanese. It’s probably named after the Japanese word for brick, “renga”, because its diagram looks like a series of bricks. Ninza Renko is an optimized Renko chart that helps traders see the trading process more accurately. Follow Zand Traders in this article to learn more about what Ninza Renko is and learn more about its benefits and features.
All about Ninza Renko
Before you get acquainted with Ninza Renko charts, you need to know what Renko charts are, what their features are and how they help traders to be more successful. Therefore, we will first introduce the Renko diagrams.
What is a Renko Chart?
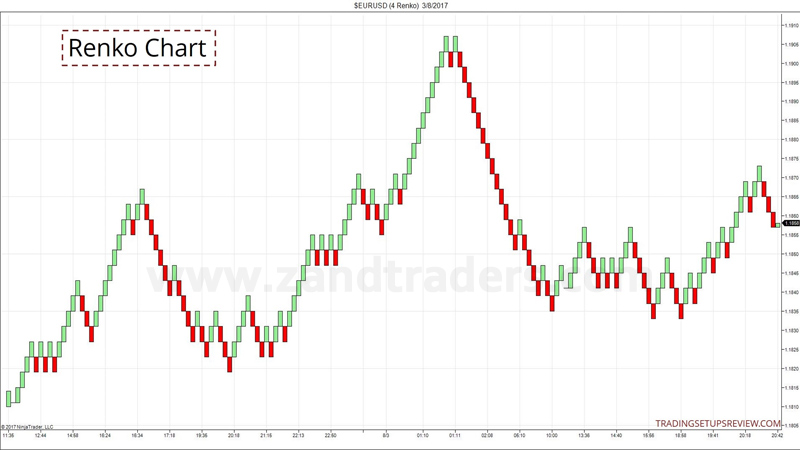
Unlike other time-based charts, the Renko chart is a price-based chart, in which a new candlestick is created when the price changes by a certain amount and each block is angled 45 degrees (up or down). The top candle is usually white or green, while the bottom candle is usually black or red.
One of the most important features of the Renko chart is that all movements are filtered smaller than the size of the candle and trend markets are easily recognizable as opposed to Choppy markets. (Choppy markets can be distinguished by alternating red and green candlesticks.)
What is Ninja Renko?
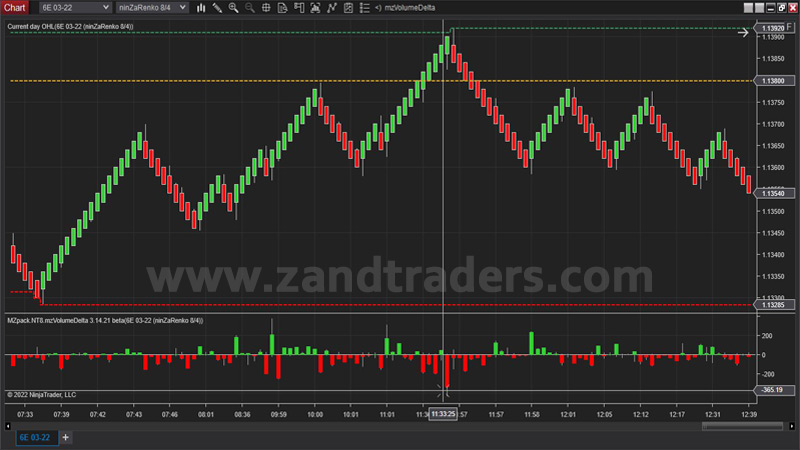
Ninza Renko is one of the best and most popular Renko candlesticks in Ninja trader, and it can be said that this tool says almost everything; NinzaRenko in Ninja trader 8 is used by thousands of traders around the world and is especially popular among them. Stay tuned to learn about the features of Ninza Renko.
Ninza Renko is one of the most popular Renko candlesticks in Ninja trader; It can be said that this Renko chart is one of the most comprehensive trading charts and everything can be seen in it; Ninza Renko is used by many traders around the world and is a very popular chart.
What are the characteristics of Ninza Renko?
We said earlier that Renko charts are one of the most optimal candles in the trade. Ninza Renko is a kind of Renko chart and has the following features.
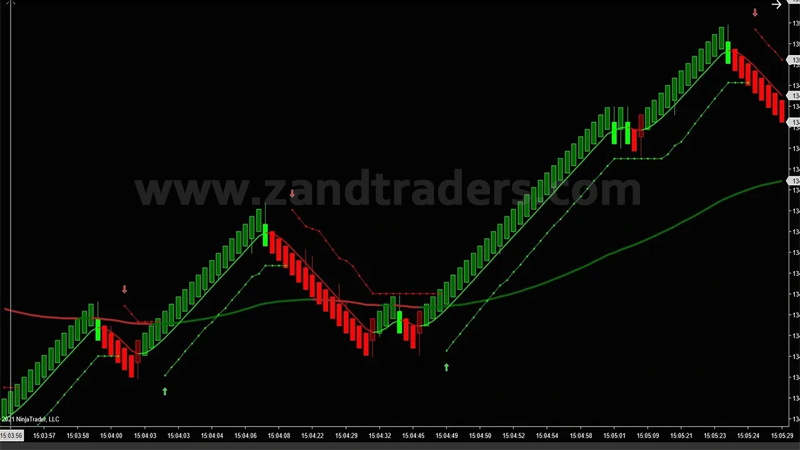
-Ninza Renko candlesticks help you visualize trends easily
-Ninja Renko allows you to print wicks, which show the lowest and highest number of bars in Renko.
-Through two simple parameters, “Brick Size” and “Trend Threshold”, Ninza Renko allows you to have complete control over how the bars are defined.
-Ninza Renko has provided the conditions for you to be optimally compatible with all the internal features of Ninja trader 8, just like a kind of default bar.
-You can use Ninza Renko for back-testing strategy
Would you like to get acquainted with the uses of Ninza Renko and know what are the uses of Ninza Renko? Please stay with us.
What are the uses of Ninza Renko?
-You can use Ninza Renko to build charts, trades and back-tests.
-Ninza Renko is used in Ninja Script trading strategies and indicators.
-Ninza Renko can be used in market analysis, hot list analysis and strategy analysis.
-Ninza Renko is also used to connect Playback and Tick Replay.
Now that you are familiar with the features and applications of Ninza Renko, we have mentioned another interesting topic for you dear ones, which is related to how to make a Renko diagram. Read the next section carefully to learn how to build a Renko chart using tools such as Ninza Renko.
How is a Renko chart made?
A Renko chart is created by placing a candlestick in the next column when the price goes above or below the previous candlestick by one candlestick. Each candlestick is positioned at a 45-degree angle (up or down) relative to the previous candlestick, for example, consider a stock, suppose a stock trades at $ 10 and its Renko candlestick is $ 0.25 in size. If the price moves to $ 10.25, a new candle will be drawn. The candle is only drawn when it closes at $ 10.25 or higher. If the price reaches only $ 10.24, no new candle will be drawn; Also, when one candle is drawn, it is not removed, and if the price rises to $ 10.50 or higher (and closes there), another candle will be drawn.
Renko candlesticks are not pulled together. For this reason, if the stock falls to $ 10.25, a lower candlestick will not be drawn next to the previous candlestick. The price should drop to $ 10 for a lower candlestick to appear below the previous candlestick.
Renko charts have a time axis, but the time scale is not fixed. Some candlesticks may take longer to form than other candlesticks, depending on how long it takes for the price to move as much as needed.
This creates Renko charts.
Trading signals in Renko charts
In Renko diagrams as well as in Ninza Renko, signals are usually generated when the direction of the trend changes. For example, a trader may sell an asset when a red candlestick appears after a series of green candlesticks are climbing. Similarly, if the maim trend is bullish (lots of green candles), when a green candle occurs after one or two red candles, a trader may decide to be in a buy position.
Which is better, Ninza Renko or HEIKIN ASHI?
Like the HEIKIN ASHI, the Ninza Renko is a Japanese candlestick, except that it is much more powerful for long movements. The main difference between these two candlesticks is that HEIKIN ASHI is a time-based chart while RENKO is a price-based chart. So they can even be combined and the combination of these two candlesticks provides very accurate signals for trading.
Another characteristic that Ninza Renko has over HEIKIN ASHI is that Renko charts are effective in identifying support and resistance levels because they have much less noise than candlestick charts and when a strong trend is formed, the Renko traders may be able to follow that trend for a long time without even a candle forming in the opposite direction.
Where can I get Ninza Renko tools?
By studying the above information about Renko candlesticks as well as the optimal Ninza Renko candlesticks, you may have a great desire to use it in your transactions; Dear friend, in order to be able to use this trading tool, you need to download and install it.
You can visit Zandtraders website at zandtraders.com to access Ninza Renko tools; for your easy access, dear Iranian traders, this tool has been placed for free in the software section for download.
Concluding remarks on Ninza Renko
In this article, we introduced you one of the best and most optimal candlesticks in trading charts, named Renko candlesticks. We also introduced you one of the best tools in this field, Ninza Renko, and now you know what Ninza Renko is and you also know its features and applications.
At the end, despite all the advantages and features of Renko candlesticks, the only limitation is that these charts do not show as much detail as candlestick or bar charts, due to their lack of time reliance. A stock that has been fluctuating for a long time may be displayed with just one candlestick, which means everything that was done at that time is not fully displayed; And this may be useful for some traders, but not for others. So pay attention to this important point as well.
We hope you find the content useful. We sincerely thank you for your constant attention and support.
Be successful and profitable.