The difference between a chart with data and without data
As you know, technical analysis is possible by having a price chart. By looking at the chart and candles, we get four types of data, which are: Open price of candle, Close price of candle, High price of candle, Low price of candle. In technical analysis, the Open/Close of candlestick points are more important because they are effective in our decision to enter or not to enter the trade.
The difference between a chart with data and without data
So, moving the Open/Close price of the candle can disrupt our trading process. To avoid this, it is better to use a chart that has data. This data is called Tick Replay and you can activate this data in your settings.
With this data, the candles are made with more precision and sensitivity, and the Open/Close of candles are recorded more accurately, so they are more reliable than the chart without data.
In the figure below, you can see two charts of EURUSD in the daily time frame, the chart on the right has data and the chart on the left has no data.
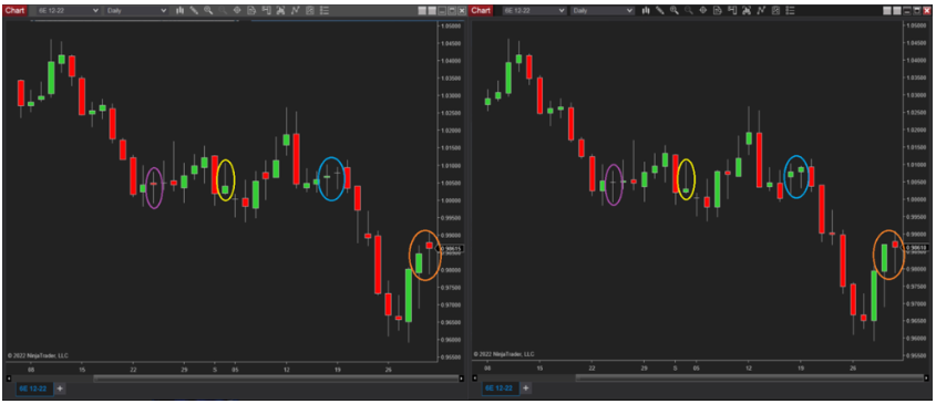
As you can see there are clearly differences. The opening and closing prices of candles are often different. It can even be seen that this difference in the closing price of the candle changed the candle and turned a doji candle into a red candle.
Chart slow loading problem with Tick Replay and its solution
Using the Tick Replay feature will use more of your system’s processor and as a result will make the graph heavier and slow down the system. Especially if you want to have more days of the chart or work with an instrument like S&P500 that has a lot of data, this slowness in the system is more noticeable.
There is a solution to prevent the system from slowing down. If you want your chart to have Tick Replay accuracy and at the same time, the system does not suffer a lot of processing load, you can use the 1440-minute chart, which is equivalent to one day, instead of opening the chart daily.
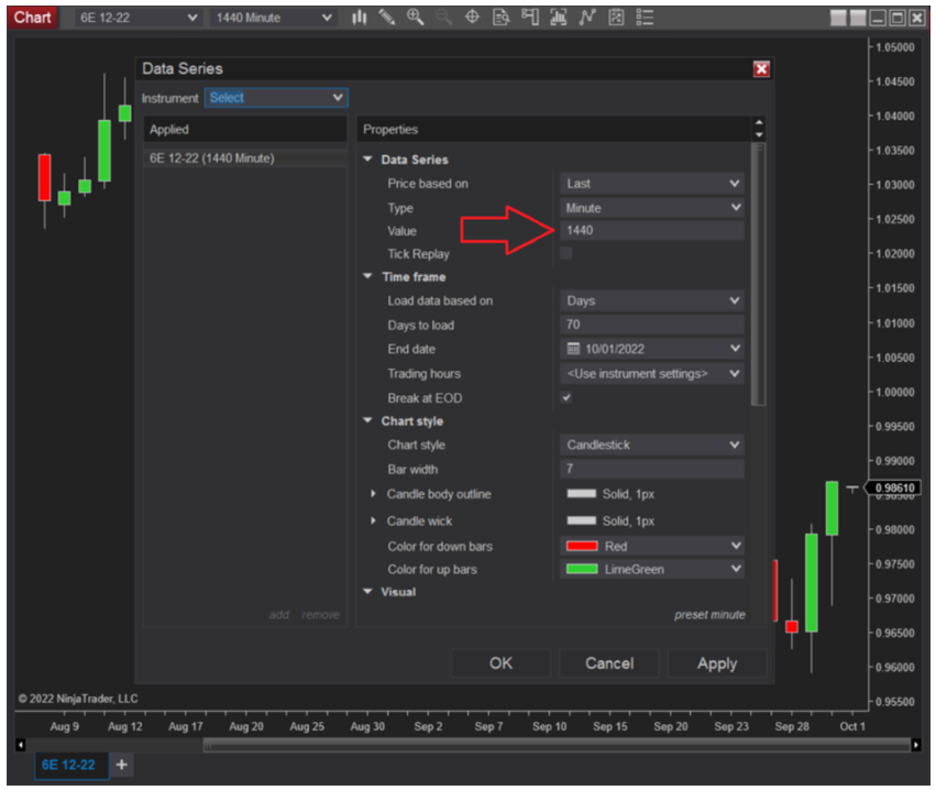
As shown in the above image, you can enter the Data Series section and select the Minute option from the Type section and enter the value 1440 in the Value section and disable the Tick Replay option.
Be careful that the 1440 minute chart may not be the same as the daily Tick Replay chart and have small differences that are often overlooked. But this chart is more accurate than the one-day chart without Tick Replay, and you can easily use it to prevent system overload.